
Tasting Room KPI
Traffic Patterns: When Are Your Best Customers Walking Through the Door?
5 min read
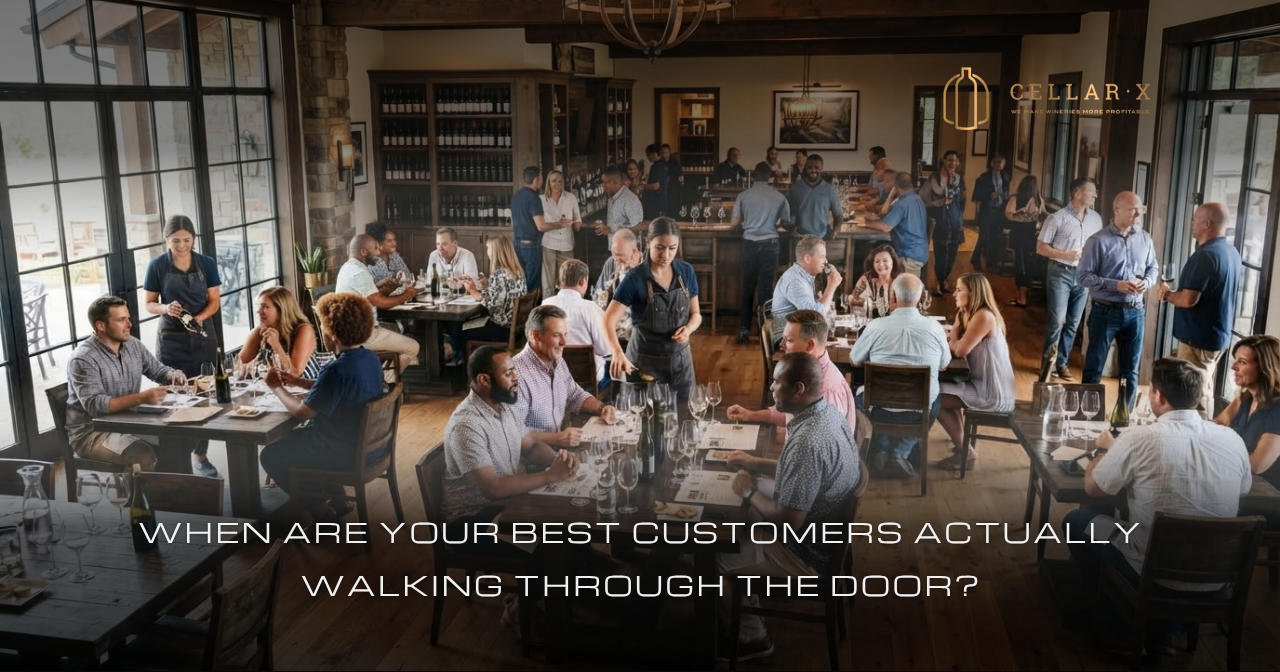
Most tasting rooms know when they are busy. Far fewer know which periods produce their strongest customers, highest conversion and most valuable long-term relationships.
Ask a tasting room team when their busiest period is and they will usually answer without hesitation. Saturday afternoon, the long weekend, harvest season, or the hour immediately after lunch when every booking seems to arrive at once. These patterns become familiar because the team experiences them physically. The room fills, the noise level rises, glasses move faster and everyone works harder to keep the experience on track.
That familiarity can make traffic feel like one of the easier tasting room measures to understand. Yet knowing when the room feels busy provides only a partial view. A winery may know that 300 people visited on Saturday without knowing where they were from, what time they arrived, how long the busiest period lasted, how many purchased, what they spent or whether the quality of the experience changed as the room filled.
Those details are where traffic data starts becoming useful, because the real question is not simply when the most people arrive. It is which periods produce the strongest customer and commercial outcomes.
Footfall Shows How Demand Arrives
Traffic measures how many people enter the tasting room and when they arrive. At its most basic, this means tracking visitors by day, hour, week, month and season so that the winery can begin to see the natural rhythm of demand.
Over time, patterns start to emerge. Certain days consistently attract more visitors, particular hours create sharp peaks, and holidays or regional events change the normal flow of the room. Walk-ins may follow a different pattern from reservations, while a new tasting experience might begin drawing visitors into periods that were previously quiet.
This information has obvious operational value because it supports staffing, reservations, stock preparation and the scheduling of tastings and events. Its commercial value becomes clearer when traffic is viewed alongside the other tasting room KPIs.
A busy period may produce the highest total revenue because more people are present, while another period generates stronger conversion, larger orders, higher satisfaction and more repeat customers from a much smaller audience. Both periods can contribute meaningful value, although the way they should be managed may differ considerably.
When High Traffic Begins to Affect the Experience
A full tasting room usually looks like success. There is energy in the room, bottles are moving and the daily revenue total is climbing, so it is understandable that management may want to recreate that level of activity more often.
The customer experience can become more difficult to maintain as traffic rises. Staff have less time with each table, tastings become more rushed and guests wait longer for their next pour or for someone to process an order. Conversations grow shorter, questions go unanswered and the quieter moments that often lead to a case purchase or wine club discussion begin to disappear.
At some point, additional traffic can start creating less value per visitor. Consider two periods at the same tasting room.
Illustrative example

Saturday generates more total revenue, with two and a half times as many visitors producing an additional $1,500 during the period. Thursday, however, creates substantially more value from each person who walks through the door. A larger share of visitors purchases, those customers spend more and satisfaction is stronger.
The figures suggest that each period requires a different response. Saturday may need more staff, tighter reservation spacing, a streamlined tasting format or a better way to manage checkout. Thursday could present an opportunity for premium experiences, longer appointments or targeted offers designed around the type of customer already visiting at that time.
Without traffic data, Saturday simply appears successful because the room is full, while Thursday risks being dismissed as an unremarkable quiet period. Once the supporting metrics are added, management can see that one period brings scale and the other delivers greater efficiency.
Booking Data Rarely Shows the Full Picture
Many wineries already have some traffic data inside their reservation system, which is a useful place to begin. It does not always reflect the actual number of people who entered the room.
A booking made for four guests may arrive with six, while another party cancels or fails to arrive. Walk-ins might represent a meaningful portion of the day’s traffic, and drivers or non-tasting companions still affect room capacity even when they are excluded from the tasting count.
Point-of-sale data has a similar limitation because it records transactions and therefore provides excellent visibility into the people who purchased. Visitors who leave without buying never reach the till, which creates a significant blind spot when the winery tries to calculate visitor-to-buyer conversion.
Reliable traffic measurement therefore needs some form of actual visitor count. Depending on the tasting room, this could come from reservation check-ins with confirmed party sizes, a simple manual tally at the entrance, door counters, occupancy sensors, tasting tickets or a combination of bookings and walk-in records.
The method does not need to be technically sophisticated. A basic hourly count recorded consistently can provide more useful insight than an advanced booking report that ignores walk-ins and no-shows.
Similar Traffic Can Bring Very Different Customers
Time of day is only one layer of the pattern. Two periods with similar visitor numbers can attract people with very different intentions and purchasing behavior.
Friday morning may bring local members collecting wine, while Saturday afternoon attracts tour groups. A weekday premium tasting could draw serious collectors, while an event weekend introduces a large number of first-time visitors who are still becoming familiar with the winery.
The volume may look similar, but the commercial potential and service requirements can differ significantly. A winery can begin adding context by comparing weekdays with weekends, reservations with walk-ins, members with non-members, first-time guests with returning customers and standard tastings with premium experiences.
Domestic and international visitors may also behave differently, particularly when shipping options influence how much wine they are able to purchase. Organized groups can create large spikes in traffic without producing the same conversion or average order value as smaller independent parties.
This does not require the tasting room team to collect an extensive profile from every person at the door. A few consistently recorded categories can begin revealing which audiences arrive at different times and what tends to happen during their visit.

Finding the Point Where the Room Starts to Strain
Every tasting room has a point where the quality of the experience becomes harder to maintain. The exact threshold depends on the physical space, staffing model, tasting format and expected level of service. A self-guided tasting can accommodate traffic differently from a seated appointment with a dedicated host.
Traffic data can help identify that threshold. A winery may find that conversion remains steady while the room serves up to 60 visitors per hour. Once traffic moves above 75, conversion begins to decline, customer satisfaction follows the same pattern and average order value softens because staff have less time to discuss the wines.
That does not necessarily mean the winery should restrict traffic to 60 visitors. It does mean that serving the next 15 well may require a different operational plan. The shift might need another staff member, a separate checkout area, more carefully staggered reservations or a dedicated host to manage arrivals before they reach the team pouring wine.
This gives management a way to see when the room begins to strain and evaluate whether an operational change improves the outcome. Instead of relying on a general sense that the team felt overwhelmed, the winery can compare traffic, conversion and satisfaction before and after the change.
Matching Staffing to the Actual Arrival Pattern
Staff schedules are often built around expected busy days, which makes sense, although daily totals can still hide the sharp peaks that create the greatest pressure.
A Saturday with 300 visitors spread evenly across eight hours creates a very different service environment from a Saturday where half the day’s traffic arrives between 1 PM and 3 PM. Hourly traffic data allows the winery to match staffing more closely to the periods when customers actually need attention.
It can also reveal where the current schedule is inefficient. The tasting room may be heavily staffed during the first hour of the day while most guests arrive later. The team might begin reducing staff just as a reliable late-afternoon peak starts, or breaks could be scheduled during a period that appears quiet on the booking calendar but regularly attracts walk-ins.
These may seem like small operational details, but across an entire season they affect labor costs, customer satisfaction, conversion and staff morale. Traffic data gives managers a stronger basis for those decisions than memory or booking totals alone.
Quiet Periods Can Hold Commercial Potential
A quieter period does not always need to be filled. Some of the tasting room’s most valuable customer experiences may happen when the team has more time to engage, answer questions and guide the purchase with greater care.
The more useful question is whether those periods attract enough of the right visitors to justify the resources required to serve them. Once a winery understands its traffic patterns, it can make more deliberate choices about how quieter times are used.
A premium appointment-only tasting may work particularly well on weekday mornings. Local member events could be scheduled during predictable quiet evenings, while partnerships with nearby hotels or tourism operators might direct a specific audience into underused time slots.
Promotions require some caution because an increase in footfall does not automatically produce a stronger commercial result. A discount may attract visitors who convert poorly, spend less and rarely return, leaving the room busier while adding relatively little long-term value.
Any attempt to increase traffic should therefore be evaluated alongside conversion, average order value, customer satisfaction and repurchase. The aim is to create demand that the tasting room has the capacity to serve well and that has a reasonable chance of becoming commercially valuable.
Seasonality Changes the Meaning of the Numbers
Tasting room traffic rarely behaves consistently throughout the year. Tourism seasons, weather, school holidays, harvest activity, regional events and changes in opening hours can all influence visitor patterns, which makes short-term comparisons difficult to interpret.
A quiet August should not automatically be judged against a busy December, and a Saturday during a major local event may offer little insight into an ordinary weekend. One large tour group can also distort an otherwise typical weekday.
Useful traffic analysis compares similar periods and looks for patterns over time. Month against the same month last year is often more informative than month against the previous month, while regular weekdays should be separated from events and holidays. Unusual groups, closures or severe weather should be noted so that managers can explain sudden movements later.
The data does not need to be perfect before it becomes useful. It simply needs enough context to prevent ordinary seasonality or an unusual event from being mistaken for a lasting change in performance.
Building a Practical Traffic Report
A useful weekly or monthly traffic report can remain fairly simple. For each day or time period, the winery can record visitor numbers, transactions or buyers, conversion rate, average order value, total revenue, revenue per visitor and customer satisfaction where that information is available.
A short note about events, weather, large groups or operational issues provides valuable context when the results are reviewed later. A day-and-time heatmap can then show where traffic concentrates across the week, while conversion or revenue per visitor helps reveal whether the busiest periods are also the most productive.
The report should lead to practical questions. At what point does traffic begin affecting satisfaction? Which quieter periods produce unusually strong conversion? Are certain customer groups arriving at predictable times? Does staffing match the actual arrival pattern? Which experiences are successfully bringing visitors into periods that would otherwise remain underused?
Those questions turn traffic from a simple headcount into a management tool that can guide scheduling, capacity planning, experience design and marketing activity.
When Are Your Best Customers Arriving?
The highest-value tasting room customer may arrive during the busiest hour of the week, although they may just as easily visit on a quiet Thursday morning, purchase only a few bottles and become a regular customer over the following years.
Traffic patterns cannot identify that person on their own, but they show the winery where and when to look. Combined with conversion, average order value, customer satisfaction and repurchase, the data begins to reveal which periods bring people through the door and which create the strongest customer outcomes.
Most tasting rooms already have a good instinct for when they feel busy. The deeper opportunity lies in understanding what those busy periods actually produce, where the room begins to lose effectiveness and when the customers with the greatest long-term potential tend to arrive.
In the next article, we will look more closely at conversion rate and the decisions a winery needs to make before it can define what a successful tasting room visit actually means.